Foreword
1. I have uploaded the configuration file described in this article to the GitHub repository in the Apollo project. You can download and use it directly.
2. I have previously written a blog "Building Apollo Project Using Visual Studio Code" (https://blog.csdn.net/davidhopper/article/details/79349927). The content of this article is not comprehensive enough. For detailed explanation.
The Apollo project is loved and praised by many developers for its excellent system architecture, complete module functionality, good open source ecosystem, and standardized code style. However, the project is compiled and debugged using the command line and cannot be developed using the IDE. It is neither intuitive nor conducive to efficiency. I am a bit of a quest for perfection, and I must find a way to get the Apollo project to compile and debug in the IDE.
Visual Studio Code (hereinafter referred to as VSCode) is Microsoft's first lightweight code editor that supports Linux. Its function is between the editor and the IDE, but it is more of an editor. The advantages are fast operation, low memory usage, and usage similar to Visual Stuio. The disadvantage is that compared to Visual Studio, QT, etc., the functionality is not powerful enough. I think that the most powerful C++ IDE in Windows is Visual Studio, and the most powerful C++ IDE in Linux is QT.
The Apollo project currently only supports Ubuntu systems (partially supported on Mac OS systems). Visual Studio on Windows systems is naturally excluded. In addition, the Apollo project uses Bazel to compile, and QT only supports QMake and CMake projects at the moment, so it can only be reluctantly cut off. Under the premise that the above two IDEs cannot be used, VSCode is selected for use.
I wrote a couple of configuration files to allow VSCode to compile and debug the Apollo project. I will elaborate on it in the following, hoping to bring some help to the developers.
{ one }
Compiling Apollo Project Using VSCode
First download the Apollo source from the GitHub website (https://github.com/ApolloAuto/apollo). You can download it using the git command or download the archive directly from the web page. After the source code is downloaded, place it in the appropriate directory. One prerequisite for building an Apollo project using VSCode is that Docker is already installed on your machine. Previous versions of Apollo provided an "install_docker.sh" script file, as many developers reported that something could go wrong and the Apollo team removed the file. To install Docker now, refer to the help documentation for the Docker official website (https://).
1.1 Compiling method
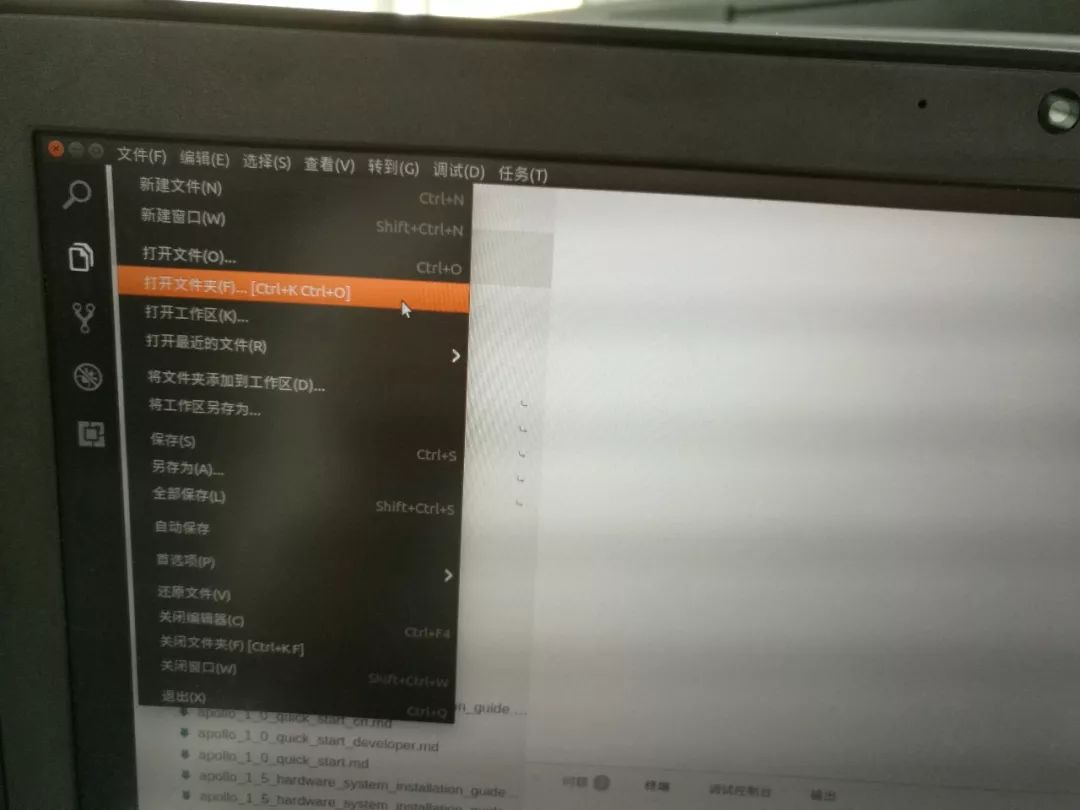
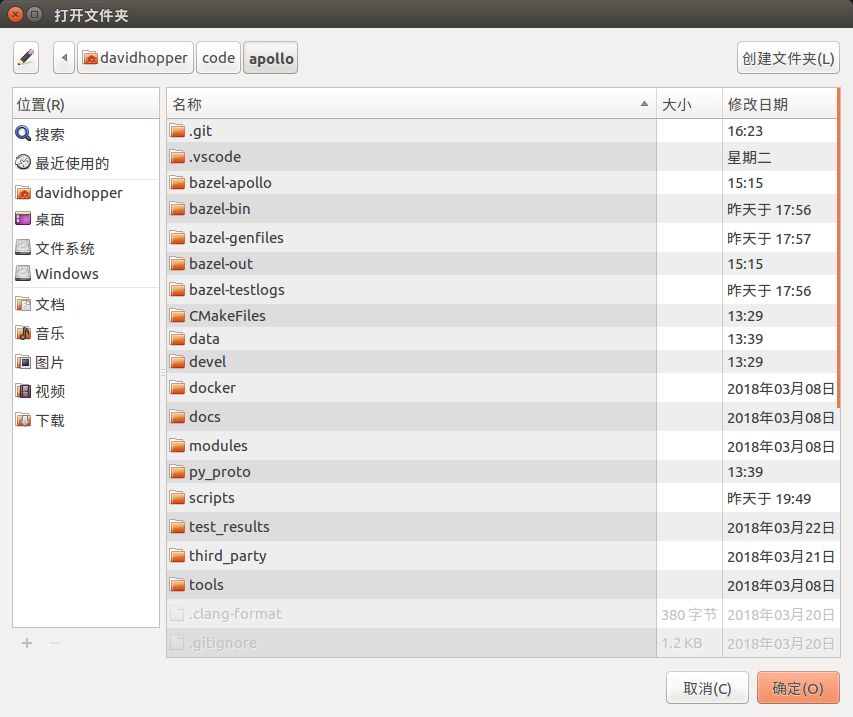
Open Visual Studio Code and execute the menu command File -> Open Folder. In the dialog box that is displayed, select the source folder of the Apollo project and click OK, as shown in the following figure:
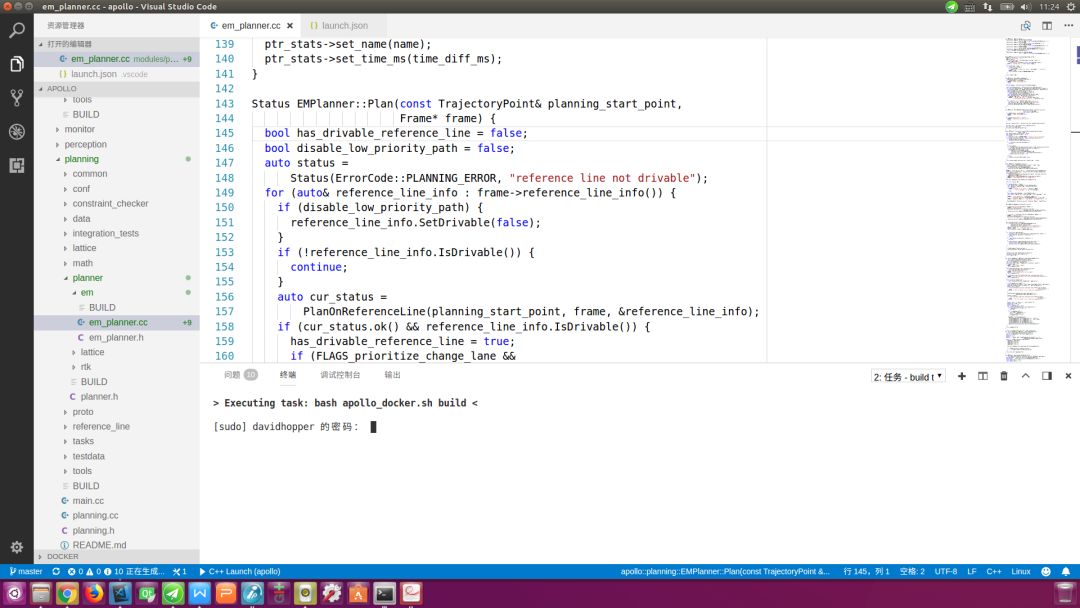
After that, execute the menu command "Tasks -> Run Generate Task" or directly press the shortcut "Ctrl + Shift + B" (consistent with the shortcut keys for Visual Studio and QT) to build the project. If you haven't started Docker before, the compiler will To start Docker, enter the password for the superuser in the bottom terminal window, as shown in the following figure:
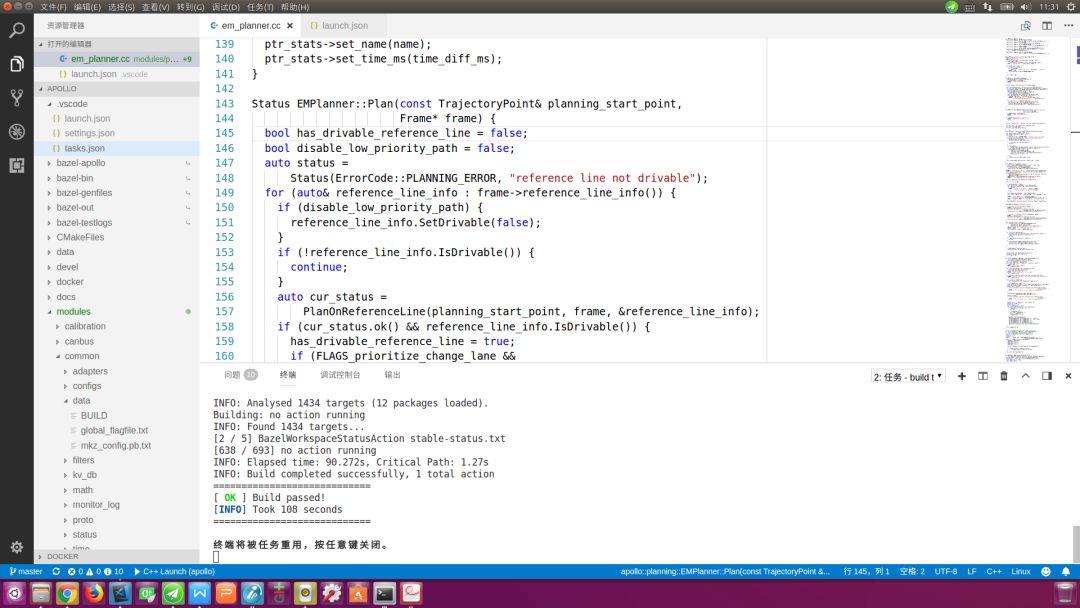
After the command execution is completed, if the message "The terminal will be reused by the task and press any key to close." appears in the bottom terminal window (as shown in the figure below), the build is successful. The entire process must keep the network unblocked, or you can't download the dependencies.
1.2 configuration file resolution
I configured a total of four common tasks in the .vscode/tasks.json file: build the apollo project (build the Apollo project), run all unit tests for the apollo project, and code style check For the apollo project (code style checking for the Apollo project), clean the apollo project. The first task is the default generation task, which can be directly called by the shortcut key “Ctr+Shift+Bâ€. Other tasks can be performed by executing the menu command: Task->Run Task(R)... In the popup window, select the corresponding The option is as shown below:

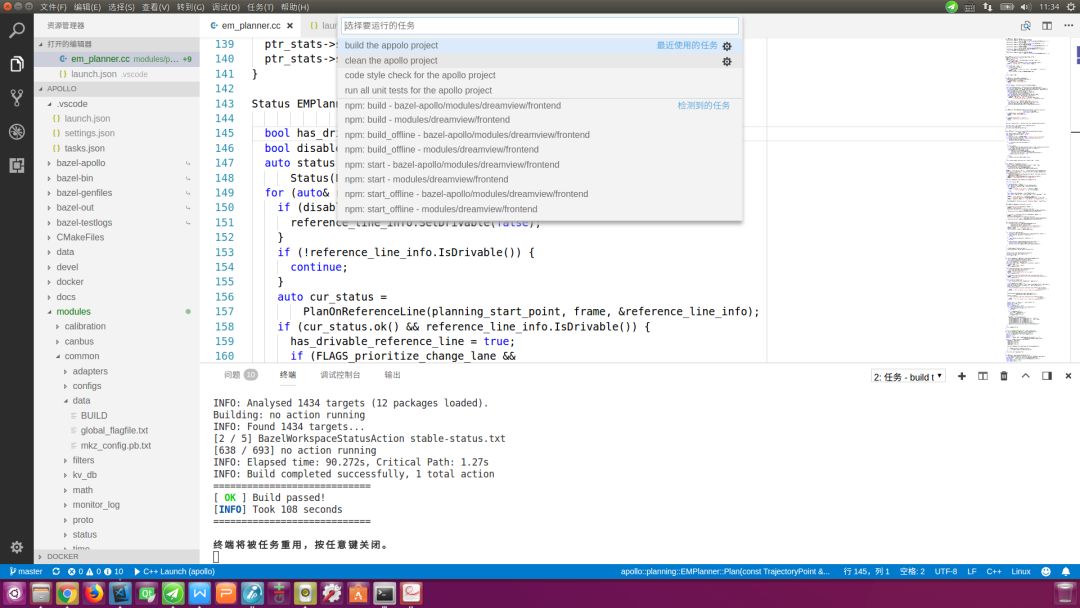
The following is the specific configuration content, please refer to the notes to adjust the compilation task to meet your build requirements:
{ "version": "2.0.0",
"tasks": [
{
"label": "build the apollo project",
"type": "shell",
// The compilation task can be adjusted based on the options provided by "apollo.sh", for example: build_gpu
"command": "bash apollo_docker.sh build",
"group": {
"kind": "build",
"isDefault": true // default building task invoked by “Ctrl+Shift+Bâ€
},
// formatting error message
"problemMatcher": {
"owner": "cc",
"fileLocation": [
"relative",
"${workspaceFolder}"
],
"pattern": {
"regexp": "^(.*):(\\d+):(\\d+):\\s+(warning|error):\\s+(.*)$",
"file": 1,
"line": 2,
"column": 3,
"severity": 4,
"message": 5
}
}
},
{
"label": "run all unit tests for the apollo project",
"type": "shell",
"command": "bash apollo_docker.sh test",
"problemMatcher": {
"owner": "cc",
"fileLocation": [
"relative",
"${workspaceFolder}"
],
"pattern": {
"regexp": "^(.*):(\\d+):(\\d+):\\s+(warning|error):\\s+(.*)$",
"file": 1,
"line": 2,
"column": 3,
"severity": 4,
"message": 5
}
}
},
{
"label": "code style check for the apollo project",
"type": "shell",
"command": "bash apollo_docker.sh lint",
"problemMatcher": {
"owner": "cc",
"fileLocation": [
"relative",
"${workspaceFolder}"
],
"pattern": {
"regexp": "^(.*):(\\d+):(\\d+):\\s+(warning|error):\\s+(.*)$",
"file": 1,
"line": 2,
"column": 3,
"severity": 4,
"message": 5
}
}
},
{
"label": "clean the apollo project",
"type": "shell",
"command": "bash apollo_docker.sh clean",
"problemMatcher": {
"owner": "cc",
"fileLocation": [
"relative",
"${workspaceFolder}"
],
"pattern": {
"regexp": "^(.*):(\\d+):(\\d+):\\s+(warning|error):\\s+(.*)$",
"file": 1,
"line": 2,
"column": 3,
"severity": 4,
"message": 5
}
}
}
]}
1.3 Possible Problems and Solutions 1.3.1 Compiled with "ERROR: Query Interrupted" Error
This is due to inconsistent bazel internal caches.
Solution:
Press any key to exit the compilation process. In the VSCode command terminal window (if not open, press the shortcut key “Ctrl + `â€) to execute the following command to enter the Docker environment:
| 1 | Bash docker/scripts/dev_into.sh |
Enter the following command in the Docker environment to perform bazel's clean-up caching task (be sure to keep the network unblocked so that dependencies can be successfully downloaded, otherwise the command will not work even if it is executed 10,000 times):
| 1 | Bazel query //... |
Finally enter the exit command to exit the Docker environment and press the shortcut key “Ctrl+Shift+B†to re-execute the build task.
1.3.2 Stay in the "Building: no action running" interface for a long time at compile time
This is due to multiple different versions of Docker or inconsistent bazel internal caches in the current system.
Solution:
Press the shortcut key “Ctrl+C†to terminate the current build process. In the VSCode command terminal window (if not open, press the shortcut key “Ctrl + `â€), use any of the following methods to stop the current running. Docker:
| 1234 | # Method 1: Stop all current Apollo projects Dockerdocker stop $ (docker ps -a | grep apollo | awk '{print $1}') # Method 2: Stop all current Dockerdocker stops $ (docker ps -aq) |
Run the VSCode menu command: Tasks -> Run Task (R)... In the popup window, select "clean the apollo project". After cleaning, press the shortcut key “Ctrl+Shift+B†to rebuild the Apollo project.
1.3.3 Compilation error similar to "Another command (pid=2466) is running. Waiting for it to complete..."
This is caused by compiling on other command line terminals or by forcibly terminating some compilation processes by pressing the "Ctrl+C" key during compilation.
Solution:
Press the shortcut key “Ctrl+C†to terminate the current build process. In the VSCode command terminal window (if not open, press the “Ctrl + `†shortcut key), use the following command to terminate the remaining compilation process:
| 123456789 | # 1. Enter Dockerbash docker/scripts/dev_into.sh# 2. Kill the process of residing in Docker pkill bazel-real# 3. Check if there is any remaining bazel-real process in Docker. If yes, press “q†to exit again. Go to step 2. # You can also use "ps aux | grep bazel-real" to view top# 4. Exit Dockerexit |
Press the shortcut key “Ctrl+Shift+B†to re-execute the build task.
{Second}
Debugging Apollo projects locally using VSCode
The Apollo project runs in Docker. It cannot use GDB debugging directly on the host (the host is the host running Docker, because the Docker service is hosted on the host, so this is called). It must be created in Docker using GDBServer. Debug the service process and use GDB to connect to the debug service process in Docker in the host. The following describes the specific operation method:
2.1 Prerequisites 2.1.1 Compiling Apollo Projects Requires Commissioning Information
When building an Apollo project, you need to use options such as build or build_gpu with debugging information. You cannot use optimization options such as build_opt or build_opt_gpu.
2.2.2 Docker has GDBServer installed
After entering Docker, you can use the following command to view:
| 1 | Gdbserver --version |
If the prompt is similar to the following information:
| 1234 | GNU gdbserver (Ubuntu 7.7.1-0ubuntu5~14.04.3) 7.7.1Copyright (C) 2014 Free Software Foundation, Inc.gdbserver is free software, covered by the GNU General Public License.This gdbserver was configured as "x86_64-linux- Gnu" |
It means that Docker has installed GDBServer internally (I have asked the Apollo team to pre-install GDBServer into Docker. Under normal circumstances you should see the above message). If you are prompted for the following information:
| 1 | Bash: gdbserver: command not found |
This indicates that Docker does not have a GDBServer installed inside. You can use the following command to install it:
| 1 | Sudo apt-get install gdbserver |
2.2Docker internal operations 2.2.1 Start Dreamview daemon
Go to Docker and start Dreamview. The command is as follows:
| 1234567 | Cd your_apollo_project_root_dir# If you do not start Docker, start it first, otherwise ignore this step bash docker/scripts/dev_start.sh -C# Enter Dockerbash docker/scripts/dev_into.sh# Start Dreamview background service bash scripts/bootstrap.sh |
2.2.2 Starting the module to be debugged
Start the module to be debugged, either by using the command line or by using the Dreamview interface. I definitely like to use Dreamview interface operation. The following uses the debugging "planning" module as an example.
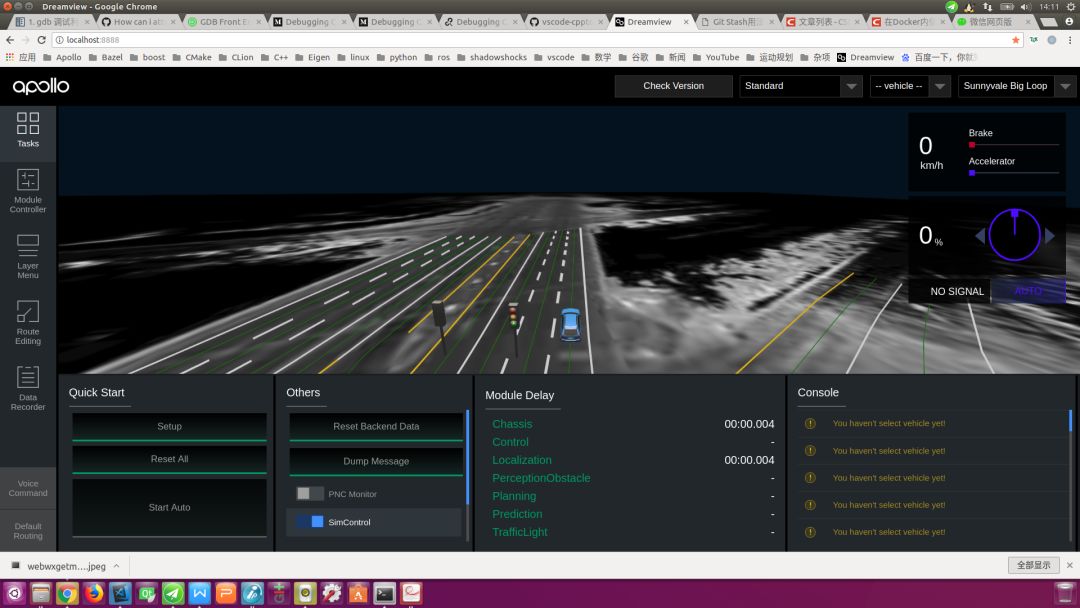
Open the Chrome browser, enter the URL: http://localhost:8888/, open the Dreamview interface, open the "SimControl" option, as shown below:
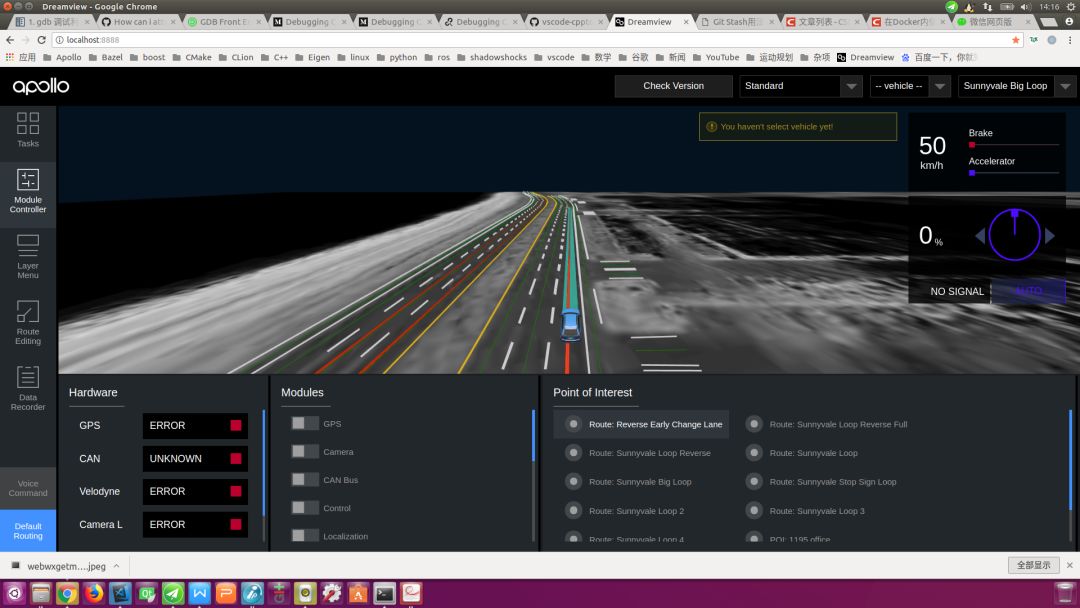
Click the "Module Controler" tab on the left toolbar and select the "Routing" and "Planning" options as shown in the following figure:

Click the "Default Routing" tab on the left toolbar and select "Route: Reverse Early Change Lane" or one of the options. Send a "Routing Request" request to generate a global navigation path, as shown in the following figure:
2.2.3 Checking the Planning Process ID
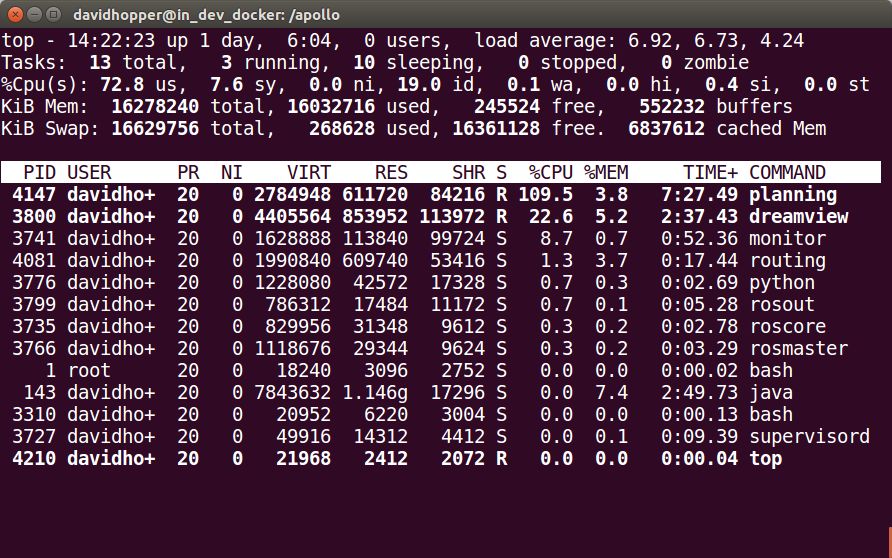
Use the following command to view the "Planning" process ID:
| 1 | Top |
The result is similar to the figure below. You can see that the "Planning" process ID is 4147. Remember this ID. Press "q" to exit the "top" interface.
You can also use the following command to view:
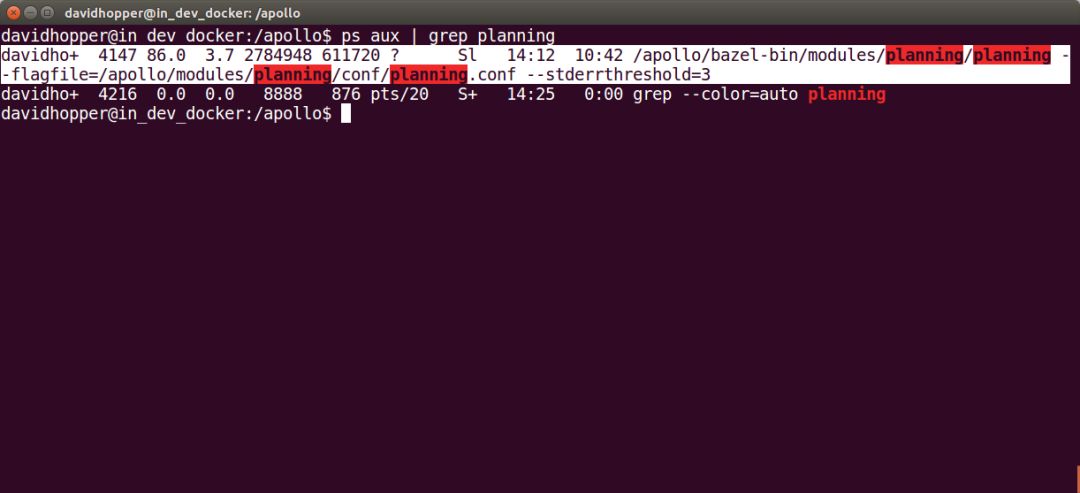
| 1 | Ps aux | grep planning |
The result is similar to the figure below. You can see that the "Planning" process ID is 4147.
2.2.4 Additional debugging "Planning" process using GDBServer
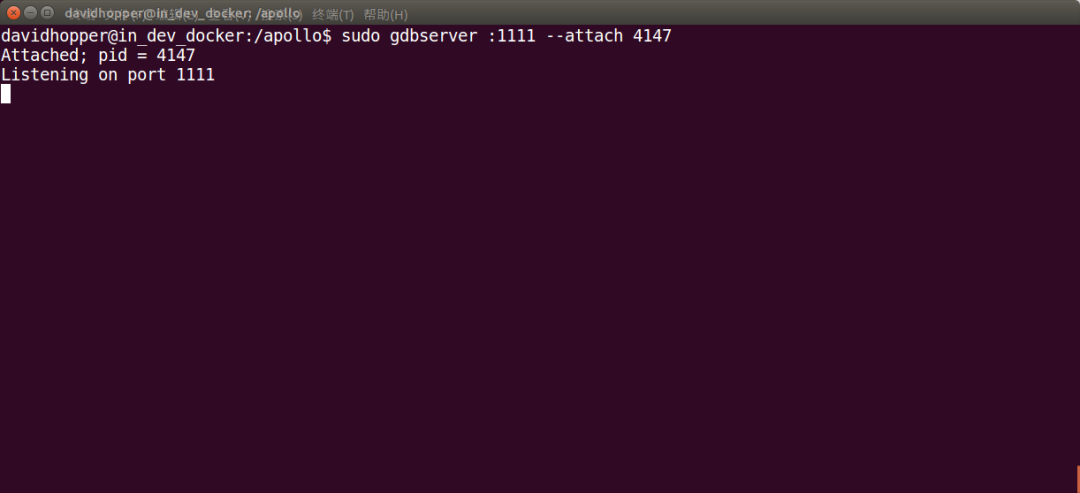
Next we need to carry out our key operations, using GDBServer additional debugging "Planning" process, the command is as follows:
| 1 | Sudo gdbserver :1111 --attach 4147 |
In the above command, ":1111" indicates the debugging service process with the port "1111" enabled, and "4147" represents the "Planning" process ID found in step 2.2.3. If the result is as shown in the figure below, the operation was successful.
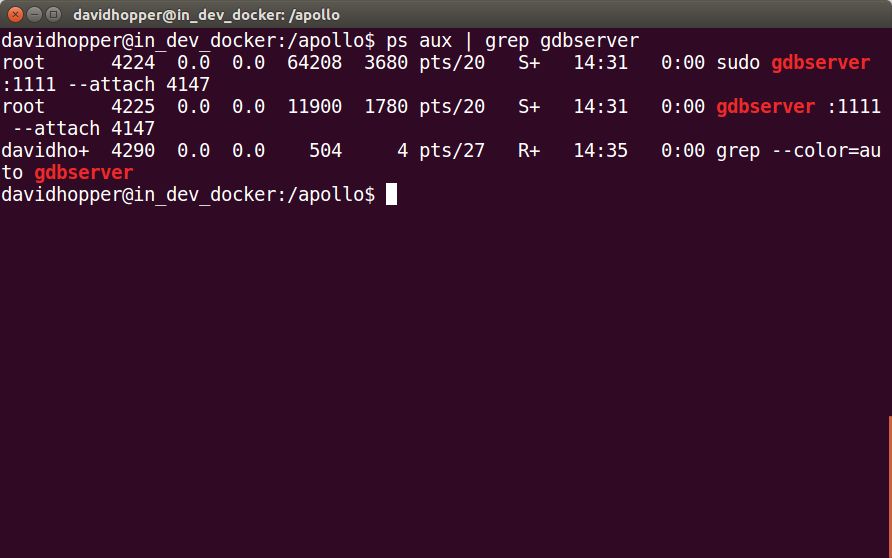
After restarting a command terminal and entering Docker, use the following command to see that the "gdbserver" process is running normally:
| 1 | Ps aux | grep gdbserver |
2.2.5 Starting GDBServer Using a Script File
I wrote two script files: scripts/start_gdb_server.sh, docker/scripts/dev_start_gdb_server.sh, the former used to start GDBServer inside Docker, and the latter started GDBServer directly on the host (outside Docker).
Assume that the debugging planning module has a port number of 1111 and the usage of scripts/start_gdb_server.sh is:
| 1234 | # Enter Dockerbash docker/scripts/dev_into.sh# Start gdbserverbash scripts/start_gdb_server.sh planning 1111 |
Assume that the debugging planning module has a port number of 1111. The use of docker/scripts/dev_start_gdb_server.sh is:
| 12 | # Start gdbserverbash docker/scripts/dev_start_gdb_server.sh directly on the host (outside Docker) planning 1111 |
In Section 2.3, I will continue to configure the VSCode file so that debugging can be started directly by pressing the shortcut key "F5" in VSCode.
The contents of start_gdb_server.sh are as follows:
#! /usr/bin/env bashfunction print_usage()
{
RED='\033[0;31m'
BLUE='\033[0;34m'
BOLD='\033[1m'
NONE='\033[0m'
Echo -e "${RED}Usage${NONE}:
.${BOLD}/start_gdb_server.sh${NONE} MODULE_NAME PORT_NUMBERâ€
Echo -e "${RED}MODULE_NAME${NONE}:
${BLUE}planning${NONE}: debug the planning module.
${BLUE}control${NONE}: debug the control module.
${BLUE}routing${NONE}: debug the routing module.
. ..,
And so on.â€
Echo -e "${RED}PORT_NUMBER${NONE}:
${NONE}a port number, such as '1111'
. }if [ $# -lt 2 ];then
Print_usage
Exit 1fiDIR="$( cd "$( dirname "${BASH_SOURCE[0]}" )"
&& pwd )"source "${DIR}/apollo_base.sh"MODULE_NAME=$1PORT_NUM=$2shift 2# If there is a gdbserver process running, stop it first.
GDBSERVER_NUMS=$(pgrep -c -x "gdbserver")if [ ${GDBSERVER_NUMS} -ne 0 ]; then
Sudo pkill -f "gdbserver"fi# Because the "grep ${MODULE_NAME}" always generates a process with the name of # "${MODULE_NAME}",
I added another grep to remove grep itself from the output.# The following command got a wrong result and I can't find the reason.
#PROCESS_ID=$(ps -eo pid,command | grep "${MODULE_NAME}"
| grep -v "grep" | awk '{print $1}')# This one is OK.PROCESS_ID=$(pgrep -o -x "${MODULE_NAME}")#echo ${PROCESS_ID}# If the moudle is not Started, start it first.
If [ -z ${PROCESS_ID} ]; then
#echo “The '${MODULE_NAME}'
Module is not started, please start it in the dreamview first. â€
#exit 1
# run function from apollo_base.sh
# run command_name module_name
Run ${MODULE_NAME} “$@†PROCESS_ID=$(pgrep -o -x “${MODULE_NAME}â€)fi sudo gdbserver
: ${PORT_NUM} --attach ${PROCESS_ID}
The contents of dev_start_gdb_server.sh are as follows:
#! /usr/bin/env bashfunction check_docker_open() { docker ps --format "{{.Names}}" | grep apollo_dev 1"/dev/null 2"&1 if [ $? ! = 0 ]; then
Echo “The docker is not started, please start it first. â€
Exit 1 fi}function print_usage() { RED='\033[0;31m'
BLUE='\033[0;34m' BOLD='\033[1m' NONE='\033[0m'
Echo -e "${RED}Usage${NONE}:
.${BOLD}/dev_debug_server.sh${NONE} MODULE_NAME PORT_NUMBER†echo -e "${RED}MODULE_NAME${NONE}: ${BLUE}planning${NONE}: debug the planning module.
${BLUE}control${NONE}: debug the control module.
${BLUE}routing${NONE}: debug the routing module.
. . .,
And so on.â€
Echo -e "${RED}PORT_NUMBER${NONE}:
${NONE}a port number, such as '1111'. }if [ $# -lt 2 ];then
Print_usage
Exit 1ficheck_docker_openDIR=“$( cd â€$( dirname “${BASH_SOURCE[0]}†) && pwd)â€cd “${DIR}/../.â€
# pwdxhost +local:root 1"/dev/null 2"&1#echo $@docker exec \ -u $USER \
-it apollo_dev \ /bin/bash scripts/start_gdb_server.sh $@xhost -local:root 1"/dev/null 2"&1
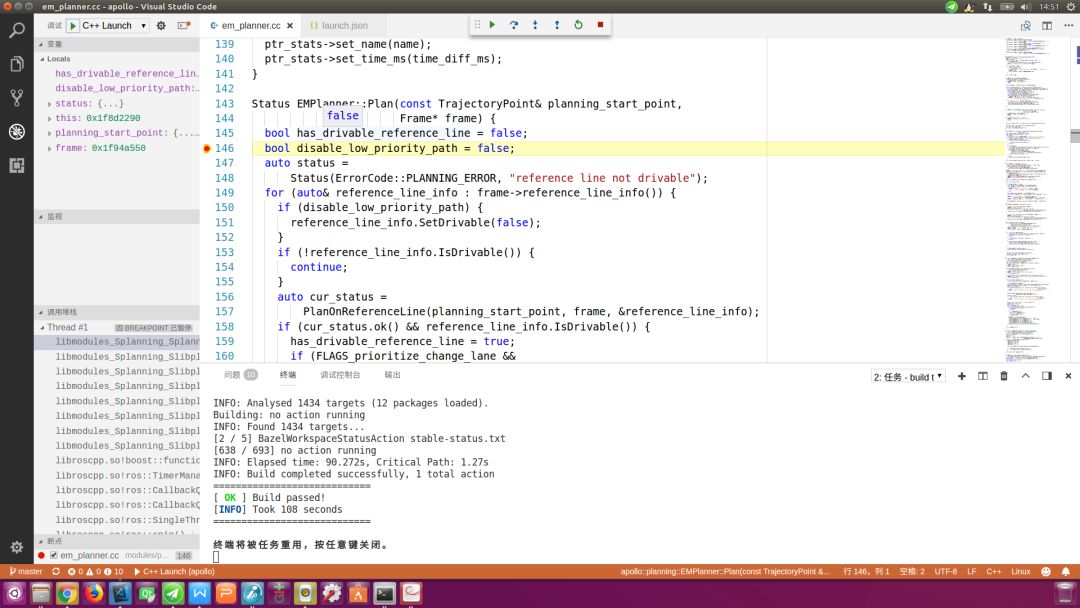
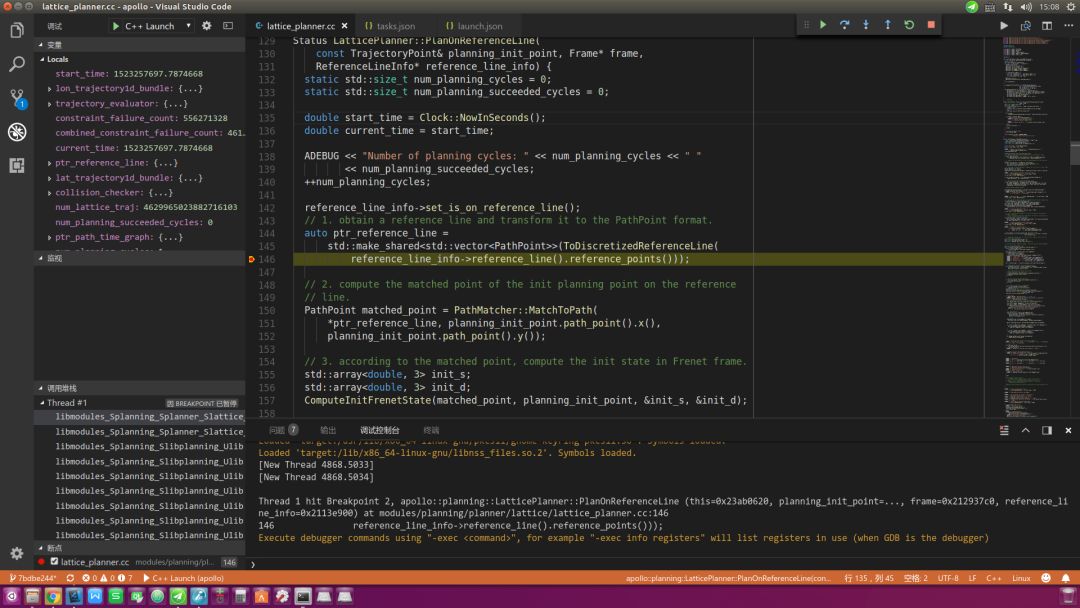
2.3 VSCode internal operations on the host
Use VSCode on the host to open the Apollo project (must be the one you just built), open the file to be debugged, set a breakpoint at the specified location, press the "F5" key to start debugging. Note: Because VSCode is written in a scripting language, the boot process will be slow. If the speed of the Internet connection is not fast enough, even a one-minute wait is possible. The debugging method is similar to Visual Studio and will not be repeated here. As shown below:
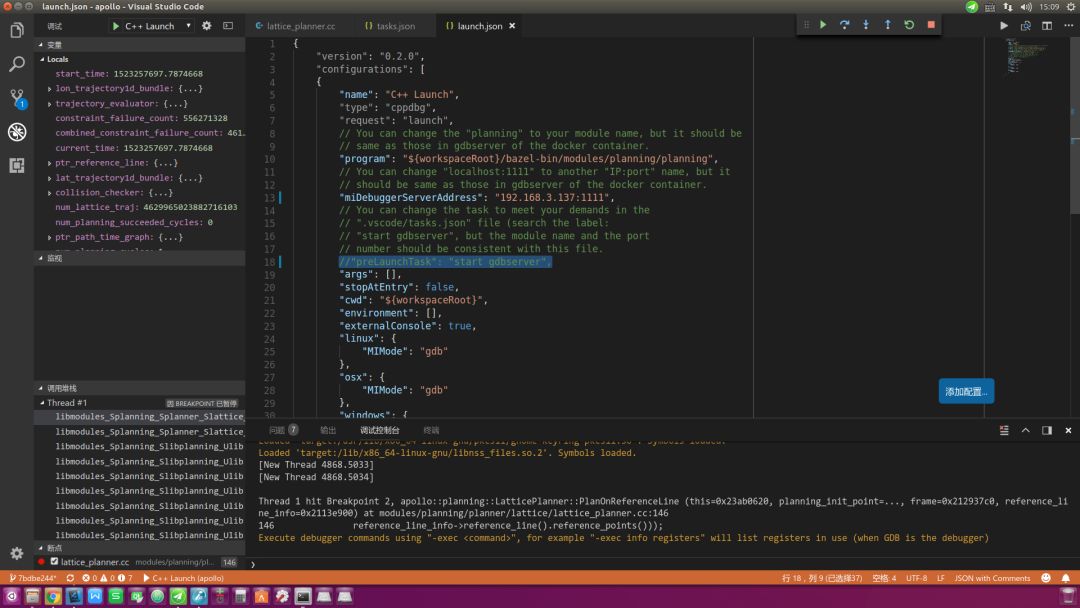
2.4 Configuration File Analysis
I configured the .vscode/launch.json file to connect the debugger process in Docker to VSCode. In addition, in order to start GDBServer directly in VSCode, I added a pre-debug startup task in the .vscode/launch.json file: "preLaunchTask": "start gdbserver". This task corresponds to the .vscode/tasks.json file. One of the tasks to start the GDBServer, because the GDBServer will always block the command line window after starting, and can not start the background by adding & & behind the command, I can only configure it as a VSCode background running tasks.
The configuration of the .vscode/launch.json file is as follows:
{ "version": "0.2.0", "configurations": [
{
"name": "C++ Launch",
"type": "cppdbg",
"request": "launch",
// You can change the “planning†to your module name, but it should be
// same as in gdbserver of the docker container.
"program": "${workspaceRoot}/bazel-bin/modules/planning/planning",
// You can change "localhost:1111" to another "IP:port" name, but it
// should be same as in gdbserver of the docker container.
"miDebuggerServerAddress": "localhost:1111",
// You can change the task to meet your demands in the
// ".vscode/tasks.json" file (search the label:
// "start gdbserver", but the module name and the port
// number should be consistent with this file.
"preLaunchTask": "start gdbserver",
"args": [],
"stopAtEntry": false,
"cwd": "${workspaceRoot}",
"environment": [],
"externalConsole": true,
"linux": {
"MIMode": "gdb"
},
"osx": {
"MIMode": "gdb"
},
"windows": {
"MIMode": "gdb"
}
}
]
}
The tasks for starting GDBServer in the .vscode/tasks.json file are configured as follows:
{
"label": "start gdbserver",
"type": "shell",
// you can change the “planning†module name to another one and
// change the "1111" to another port number.
// Note: the module name and port number should be same as in
// the "launch.json" file.
"command": "bash docker/scripts/dev_start_gdb_server.sh planning 1111",
"isBackground": true,
"problemMatcher": {
"owner": "custom",
"pattern": {
"regexp": "__________"
},
"background": {
"activeOnStart": true,
// Don't change the following two lines, otherwise the
// gdbserver can't run in the background.
"beginsPattern": "^Listening on port$",
"endsPattern": "^$"
}
}
}
2.5 Possible problems and solutions The tasks for starting GDBServer in the .vscode/tasks.json file are configured as follows:
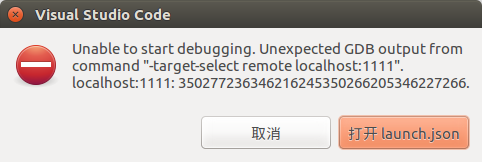
During the debugging process, you may encounter the following problems:
One is that Docker's internal debugging process crashes and cannot be debugged in VSCode (as shown in the following figure). The solution is to restart Docker's internal debugging process.
The second problem is that the network connection is not smooth and cannot be debugged in VSCode. The solution is to ensure that the network is unblocked and the agent tools are disabled.
Thirdly, after debugging is turned off within VSCode, the internal debugging service process of Docker will be closed at the same time. It may happen that the debugging service miles cannot be started again directly in VSCode. The solution is to restart the debugging service process inside Docker and then in VSCode. Press "F5" to start debugging.
{ three }
Remote debugging Apollo project using VSCode
During the R&D process, we also needed to remotely debug the Apollo project on the IPC in the car. That is to connect the IPC in the debugging computer with the SSH service, start the relevant process in the IPC, and perform remote debugging on the debugging computer. The following describes the debugging planning module as an example:
3.1 Check the IP address of the IPC in the car
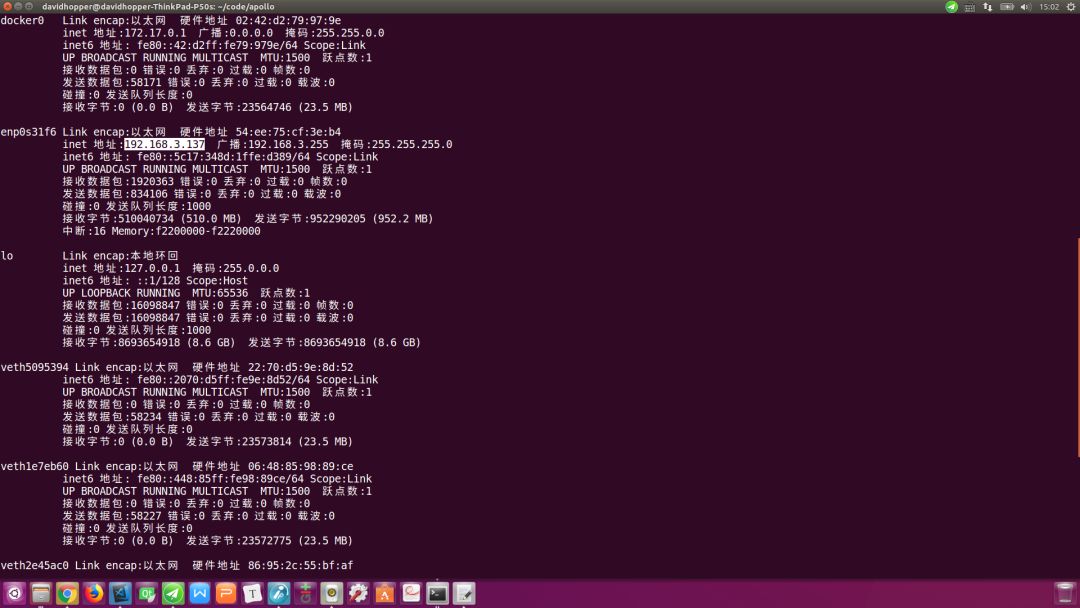
On the in-vehicle IPC, check the local IP through the following command:
| 1 | Ifconfig |
As shown in the figure below, the selected white part: 192.168.3.137 is the LAN IP address of the IPC in the car.
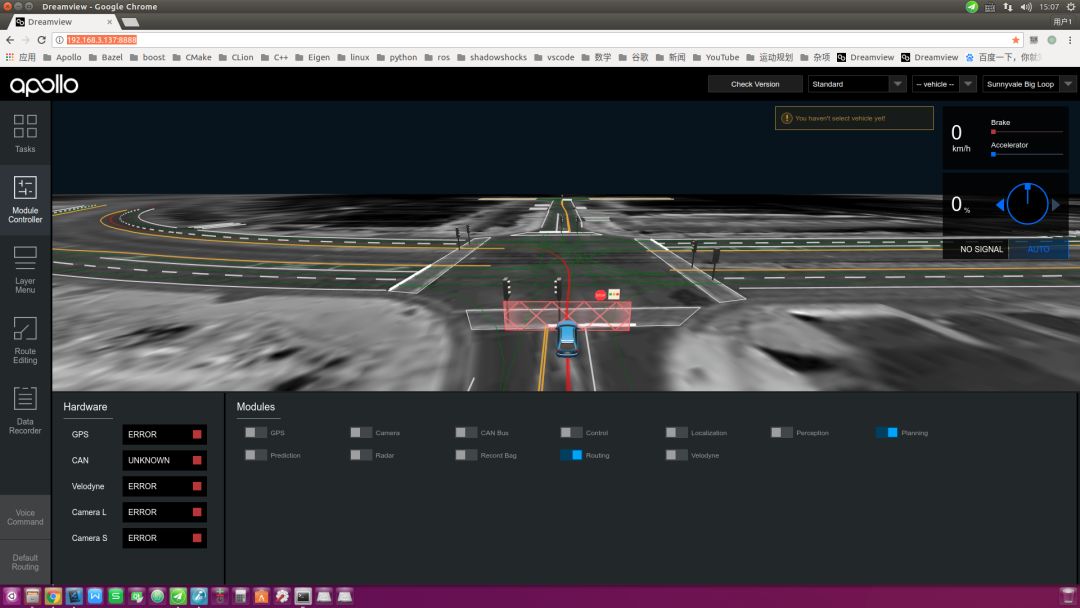
3.2 Open Dreamview and start the module to be debugged in the debugger's browser
Assume that the IP address of the IPC in the vehicle is: 192.168.3.137. Open the Chrome or Firefox browser and enter the following URL: http://192.168.3.137:8888/. Start the planing to be debugged according to the method in section 2.2.2. And its dependent routing module.
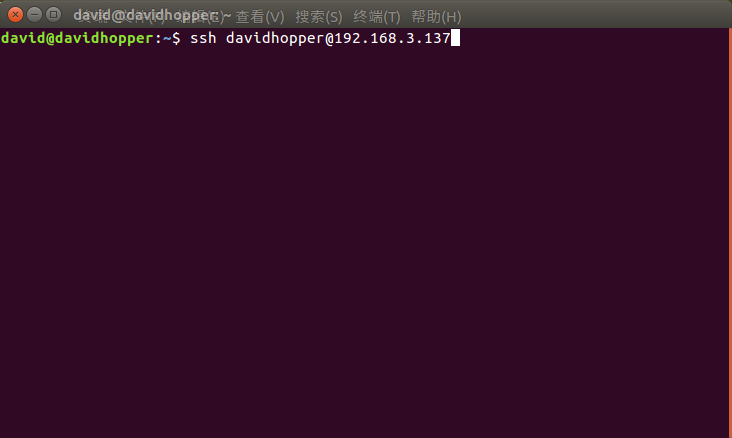
3.3 Remote login to the IPC and start the gdbserver service of the IPC using the SSH command
Assume that the IP address of the IPC in the car is davidhopper. The IP address of the LAN is 192.168.3.137. Use the following command to remotely log in the IPC:
| 1 | Ssh .3.137 |
After successfully entering the IPC, suppose that the planning module needs to be debugged. The port number is 1111. Use the following command to start the gdbserver service of the IPC in the car:
| 1234 | # Switch to the root directory of the Apollo project on the IPC. cd ~/code/apollo# Start the gdbserver service outside of Docker bash docker/scripts/dev_start_gdb_server.sh planning 1111 |
As shown in the following figure, if you see a prompt similar to Listening on port 1111, the gdbserver service starts successfully.

3.4 Using VSCode on Debugging Computer to Remotely Debug the Planning Module on IPC
Use VSCode to open the Apollo project on the debugging computer. Note that the project version should be the same as the version on the IPC. Otherwise debugging will output a lot of inconsistent information. First, comment out the pre-debug load task line in the configuration file .vscode/launch.json: "preLaunchTask": "start gdbserver", comment it out, and change the remote debug service address to "miDebuggerServerAddress": "192.168.3.137:1111 ",,As shown below:
Set a breakpoint at the desired location and press F5 to start debugging. Because it is a remote connection, the startup wait time will be longer, even more than 1 minute. The following figure is the remote debugging interface. Note: After suspending debugging in VSCode, when you need to start debugging again, be sure to execute the operation of Section 3.3 again in the command line terminal to restart the gdbserver service process in the IPC. In native debugging, this step can be omitted because I configured a preLaunchTask task.
Since the opening of the Apollo platform has come, we have received a lot of developer's advice and feedback, more and more developers based on Apollo wiped out more sparks, and is willing to contribute their own results, which fully reflects the Apollo "contribution The more you get, the more you get the open source spirit. To this end, we have opened a "Developers Say" section, hoping that developers can actively contribute and contribute to creating a shared communication platform for the majority of autonomous driving developers!
The utility model relates to a medical atomization treatment and humidifying device belonging to the technical field of medical equipment and household appliances.
Professional Medical Atomization manufacturer is located in China, including Medical Vape,Dose Control Vape Pen,Supersonic Wave Vape, etc.
Medical Atomization,Medical Vape,Dose Control Vape Pen,Supersonic Wave Vape
Shenzhen MASON VAP Technology Co., Ltd. , https://www.disposablevapepenfactory.com