[background]
This article refers to the address: http://
Call center is always an important link connecting enterprises, markets and consumers. The quality of its service directly determines the consumer's direct consumption perception. Especially in the mobile era, the real-time, online, dynamic, and instant feedback consumption characteristics put forward higher requirements for accurately counting customer satisfaction and responding to customer needs quickly and without error. Therefore, the call center's assessment criteria need not be redefined.
Traditionally, companies generally test the relevance of quality inspections to customer satisfaction. However, this quality check is often inconsistent with the customer satisfaction of the call center. This directly affects the quality of service control of the call center and poses a potential risk to the consumer perception of the enterprise.
So, what causes the failure of the traditional way? How to update the quality inspection method to ensure the accuracy and improvement of customer satisfaction to meet the new requirements of the mobile era? All this will be from the existing call center customer satisfaction optimization method Start.
In order to accurately control the customer satisfaction of the call center, enterprises have established a unified quality control (QC) scoring standard. However, this set of QC standards is often not related to call center customer satisfaction. This stems from the statistical method of the way it is evaluated.
[text]
The common practice of measuring correlation is to use the quality inspection scores and customer satisfaction to do the correlation test. The test uses the Pearson correlation coefficient (the CORREL function commonly used in Excel). From a statistical point of view: Pearson The correlation coefficient is a test for a continuous variable that conforms to a normal distribution, that is, it is required to operate on the quality inspection results of N employees and the satisfaction result data of N employees. The data of satisfaction is very easy to obtain and meets the sample size requirement, but the quality inspection score of N employees is the quality inspection score calculated by the spot check, and does not represent the actual quality inspection score of the employee. Therefore, it is derived from these data. The Pearson correlation coefficient is not accurate.
Take a look at the calculation results of the Sampling Calculator:
Assume that the customer satisfaction of the call center is 90%, then the historical defect ratio is 10%; 22 working days, the daily wiring is 80, the sample size of one month is: 22x80=1760, and the sample size that needs to be checked is 315. Pass (see Appendix 1 for specific data)
According to the industry level, the number of recordings that a seat can draw in a month is about 20 passes.
Statistical conclusion: The quality scores calculated by the spot check itself do not represent the actual quality test results of the employees, so the correct conclusion cannot be drawn.
The question then comes, how to determine the correlation between quality inspection results and customer satisfaction? Is the quality inspection standard related to the actual needs of customers?
In fact, the operation is very simple: the correlation between the single-pass recording score and the single-pass recording customer satisfaction is introduced, that is, the logistic regression analysis method is used to calculate the correlation for the N-column discrete data.
Single-pass recording scores are as follows:
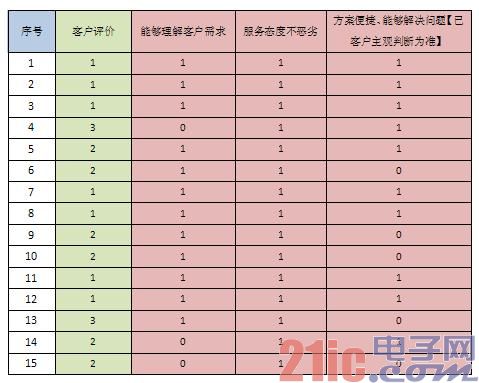
What is the correlation between the score of the score table and the satisfaction of the customer evaluation?
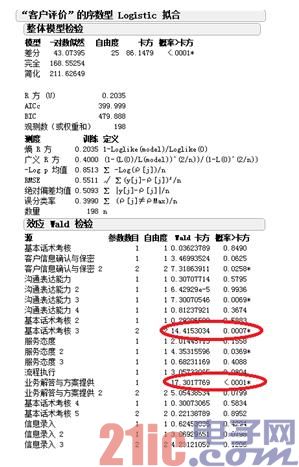
Using the Logistic analysis operation in the JMP software, the resulting W test data is as follows:
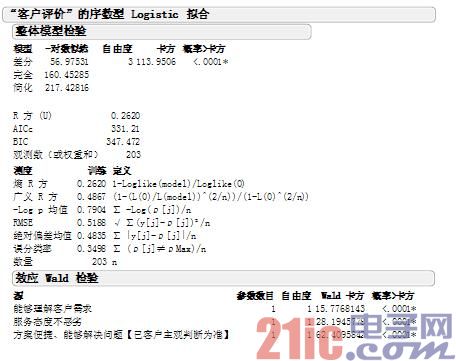
It can be seen that the chi-square values ​​of these three scoring standards and customer satisfaction are very high, and the P value is lower than 0.005, indicating that this standard is related to customer satisfaction.
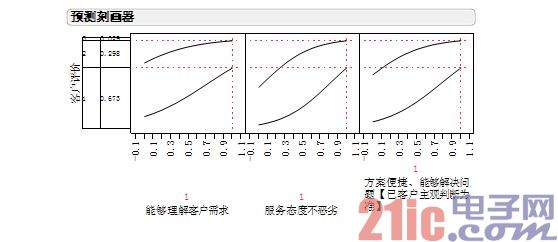
At the same time, you can use JMP's unique "scriber" tool to make predictions, which allows us to clearly understand the impact of these three quality test results on satisfaction.
If all three items get 1 point, the customer's dissatisfaction is 3%.
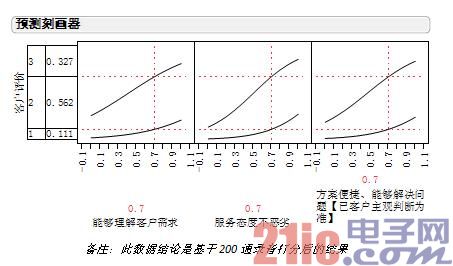
If all three items get 0.7 points, the customer's dissatisfaction is 32%.
If this calculation model that evaluates the correlation between quality inspection standards and customer satisfaction is used, the correlation between the company's score table and customer satisfaction is calculated. Without any surprise, the correlation between quality inspection standards and customer satisfaction will be poor.
If you look at this issue from a business perspective:
A number of items in the quality inspection scoring standard are required by the company, for example, to call the customer's last name, to confirm the customer's problem, to increase the moderate tone of speech, etc., not to mention the background CRM entry, process execution, work order distribution accuracy, etc. But don't be discouraged. In this way, if you can find 2-3 scoring standards with high correlation, it is very good!
Example:
Best Solar Flood Lights,Solar Motion Flood Lights,Solar Sensor Security Light,Commercial Solar Flood Lights
Jiangmen Liangtu Photoelectric Technology Co., Ltd. , https://www.liangtulight.com