Abstract: When the electric vehicle motor output is overloaded at low speed and large current, the junction temperature of the IGBT module of the driver will quickly rise and easily exceed the safe working area and cause failure. If the transient thermal resistance characteristics of the heat dissipation circuit are used in the system design stage, and the current output at low speed is accurately controlled by simulation calculation, the reliability and power density of the electric vehicle drive system will be better improved. This article first introduces the transient thermal resistance characteristics of IGBT modules and heat sinks; then analyzes the effect of current overload output on the IGBT module junction temperature rise at low and normal speeds in electric vehicle motor drivers; finally introduces how to use Infineon Ling IPOSIM simulation tool simulates the junction temperature of IGBT module during overload output, and the simulation results of IGBT instantaneous junction temperature under different working conditions. This article can provide a reference for the dynamic selection of IGBT output limits in the design of electric vehicle motor drivers.
1 Introduction
With the development and maturity of electric vehicle drive technology and the increasing market demand for electric vehicle drive performance and reliability, the development of electric vehicle drive systems will move toward: high power density, high reliability, and low cost. However, the higher power density and lower cost will inevitably reduce the system design margin. If the simulation calculation is inaccurate or designed based on experience only, it is easy to cause overtemperature or shutdown of the power device such as the IGBT of the motor driver. The RBSOA (Reverse Biased Safe OperaTIng Area) is damaged.
When the system is overloaded for a short time with large current, the chip junction temperature of the IGBT module will rise dynamically. If there is not enough design margin or the output overload time and overload current multiple cannot be accurately controlled, the IGBT junction temperature may rise beyond the safe operating area and cause failure. In response to these problems, this article analyzes the relationship between overload output and IGBT junction temperature under different output frequencies to help hardware design engineers correctly limit the overload peak during R & D.
2 Dynamic junction temperature and dynamic temperature rise of IGBT module and heat sink
Both the bottom shell substrate of the IGBT module and the heat sink have two characteristics of thermal resistance and thermal capacity. Thermal resistance is a comprehensive parameter that reflects the ability of a thermally conductive medium to hinder heat conduction. According to the definition of thermal resistance Rth, it is the ratio of the temperature difference ΔT on the heat flow path to the total power loss
Due to the simultaneous action of thermal resistance and thermal capacity characteristics, dynamic thermal resistance characteristics are produced. There are generally two ways to model to express the dynamic thermal resistance characteristics-T-type model and π-type model. As shown in Figure 1.
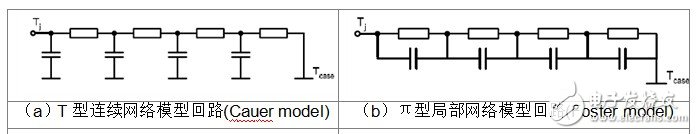
(A) T-type continuous network model loop (Cauer model) (b) π-type local network model loop (Foster model)
Figure 1 Schematic diagram of the two models
As shown in Figure 1 (a), the structure of the T-shaped model reflects the real physical structure of the thermal resistance and heat capacity. If the material parameters of each layer in the heat dissipation system are known, the results of this model can be established through theoretical calculation formulas. However, it is difficult to determine the distribution of heat propagation in each layer during heat propagation, so T-type loops are generally not used in actual modeling.
Although the π-type model in Figure 1 (b) has no specific physical meaning in structure, the mathematical model of this model is relatively easy to extract from the time-thermal resistance curve of the actual measurement calibration, so π is generally used Model to give the fractional factor of the dynamic thermal resistance curve. The data sheets of Infineon IGBT modules give the fractional factors and curves of the π-type loops of IGBT chips and anti-parallel diode chips, as shown in Figure 2 for the dynamic thermal resistance curve of Infineon FF600R12ME4 module.

(A) IGBT dynamic thermal resistance curve (b) anti-parallel diode dynamic thermal resistance curve
Figure 2 Infineon IGBT module dynamic thermal resistance curve
Given in figure 2
The dynamic thermal resistance curve can be expressed as:
If during the dynamic temperature rise, the loss P (t) of the IGBT module is known and the temperature of the bottom case of the IGBT module is known, the junction temperature of the IGBT and diode chip can be obtained by the following formula:
In formula (4), P (t) is limited to the power of a single square wave pulse. IGBT modules are generally continuous pulses in practical applications, and continuous pulses of power changes in sinusoidal modulation. The calculation formula is more complicated, which can be obtained from IEC60747 Checked in the -6 standard [1].
In addition, the transient thermal resistance of the heat sink and the interface between the module and the heat sink needs to be considered. At the same time, the IGBT module case and terminals also have a small amount of convection heat conduction, but the influence of convection heat conduction is very small and negligible compared to the heat conduction of the bottom case. The series π-type network model combined by the entire heat dissipation system can be represented by Figure (3).
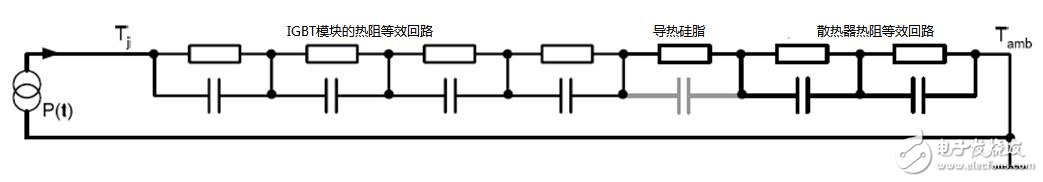
Fig. 3 Combined π-type thermal resistance network model
Generally, the heat sink manufacturer will give the first-order heat balance time, which is 3 times the value. The first-order fractional fitting can be expressed as a formula:
The formula for calculating the IGBT junction temperature considering the thermal resistance of the heat sink is:
For the heat balance time of the radiator is generally tens of seconds to hundreds of seconds, the temperature rise of the radiator can be ignored when calculating the low frequency output, and the formula (4) can be used when calculating. If the thermal equilibrium time of the system is in the order of a few seconds, the formula (6) can be used to calculate the temperature rise of the radiator. For a more accurate multi-order thermal resistance model including thermal grease on the contact surface, an experimental calibration curve is needed to extract the model. For the specific experimental extraction method, please refer to Document 2, which will not be described in detail in this article.
The characteristics of the dynamic thermal resistance of the IGBT module cause the IGBTs in the three-phase inverter bridge in the driver to have different junction temperature fluctuations at different output frequencies. In a half-wave period, the IGBT of one of the bridge arms in a half-bridge is in continuous load operation. With the IGBT switching frequency unchanged, the lower the output frequency, the longer the continuous load time of one bridge arm, one half-wave The greater the total internal energy loss. At the same time, because the dynamic thermal resistance of the IGBT module rises rapidly within 1 second, the lower the output frequency, the greater the fluctuation in the junction temperature of the IGBT.
IGBT modules of the same model output sine waves with an effective current of 200A at four frequencies of 1Hz, 5Hz, 20Hz, and 50Hz under the conditions of Vdc = 600V and fsw = 10KHz, respectively. The IGBT junction temperature fluctuation curve is shown in Figure 4: (IPOSIM's simulation principle of IGBT loss and junction temperature is detailed in Reference 3)
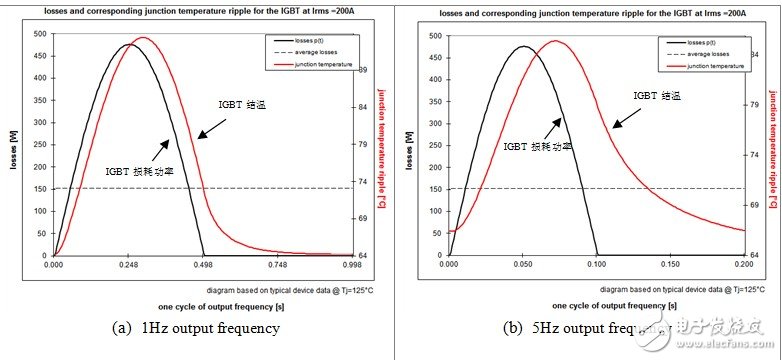
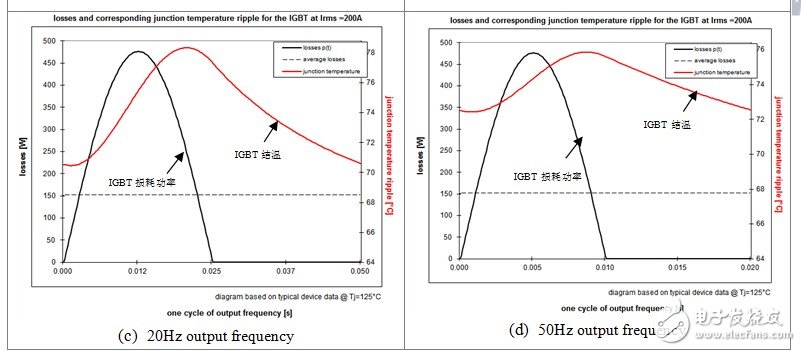
Figure 4 Comparison of IGBT junction temperature fluctuations of one bridge arm at different output frequencies
Looking at the four simulation results in Figure 4, the average power loss of the IGBT under all four operating conditions is always 150W. In (a), the maximum IGBT junction temperature exceeds 90 ° C at 1 Hz. In (d), the output frequency is 50Hz and the junction temperature is less than 76 ° C. The reason is that due to the long single commutation cycle time, the junction temperature fluctuates greatly.
What can Power Balance Bracelet do?
Every biochemical reaction in the human body is produced after a series of electron exchanges occur at the microscopic level. When these tiny electrons coordinate and orderly interact, the human body is in an optimal state. The energy bracelet relies on bio-sensing. It can receive a frequency of 7.8 Hz in a moment, and instantly change the way the human body interacts with the electromagnetic field environment, helping the human body to receive the natural frequency signal instantaneously, so that the body can effectively adjust to the best balanced condition.
Power Balance Bracelet description:
1.Product name:Silicone Energy Bracelet,power balance bracelet, Power Bracelet Energy ,X Power Energy Bracelet, Wristband Power Bank ,Quantum Energy Bracelet
2.Place of origin:Guangdong China
3.Color:any pantone color is available
4.Logo:printed,debossed,embossed
5.MOQ:500pcs.
6.Package:opp bag,customized design is available.
7.Design:Customized
8.Certification:FDA,LFGB,SGS,ROHS,etc.
9.Usage:Gifts/Sports
10.Power Balance Bracelet photos for reference

Power Balance Bracelet
Silicone Energy Bracelet,Power Balance Bracelet,Power Bracelet Energy,X Power Energy Bracelet,Wristband Power Bank,Quantum Energy Bracelet
OK Silicone Gift Co., Ltd. , https://www.oemsiliconegift.com